
Nordic Electricity Market – Q3 2026
During Q3 2026, imbalance prices were less volatile than a year earlier, while absolute imbalance levels increased in Sweden and Denmark. Market participant growth continued across the Nordic countries, and reserve activation costs became more stable.
This report reviews key developments in the Nordic electricity markets during the third quarter of 2026 from an imbalance settlement perspective. It focuses on imbalance prices, volumes, and market participant behavior. The report is based on data available at the time the imbalance settlement for the quarter is closed.
Imbalance price volatility lower than a year ago
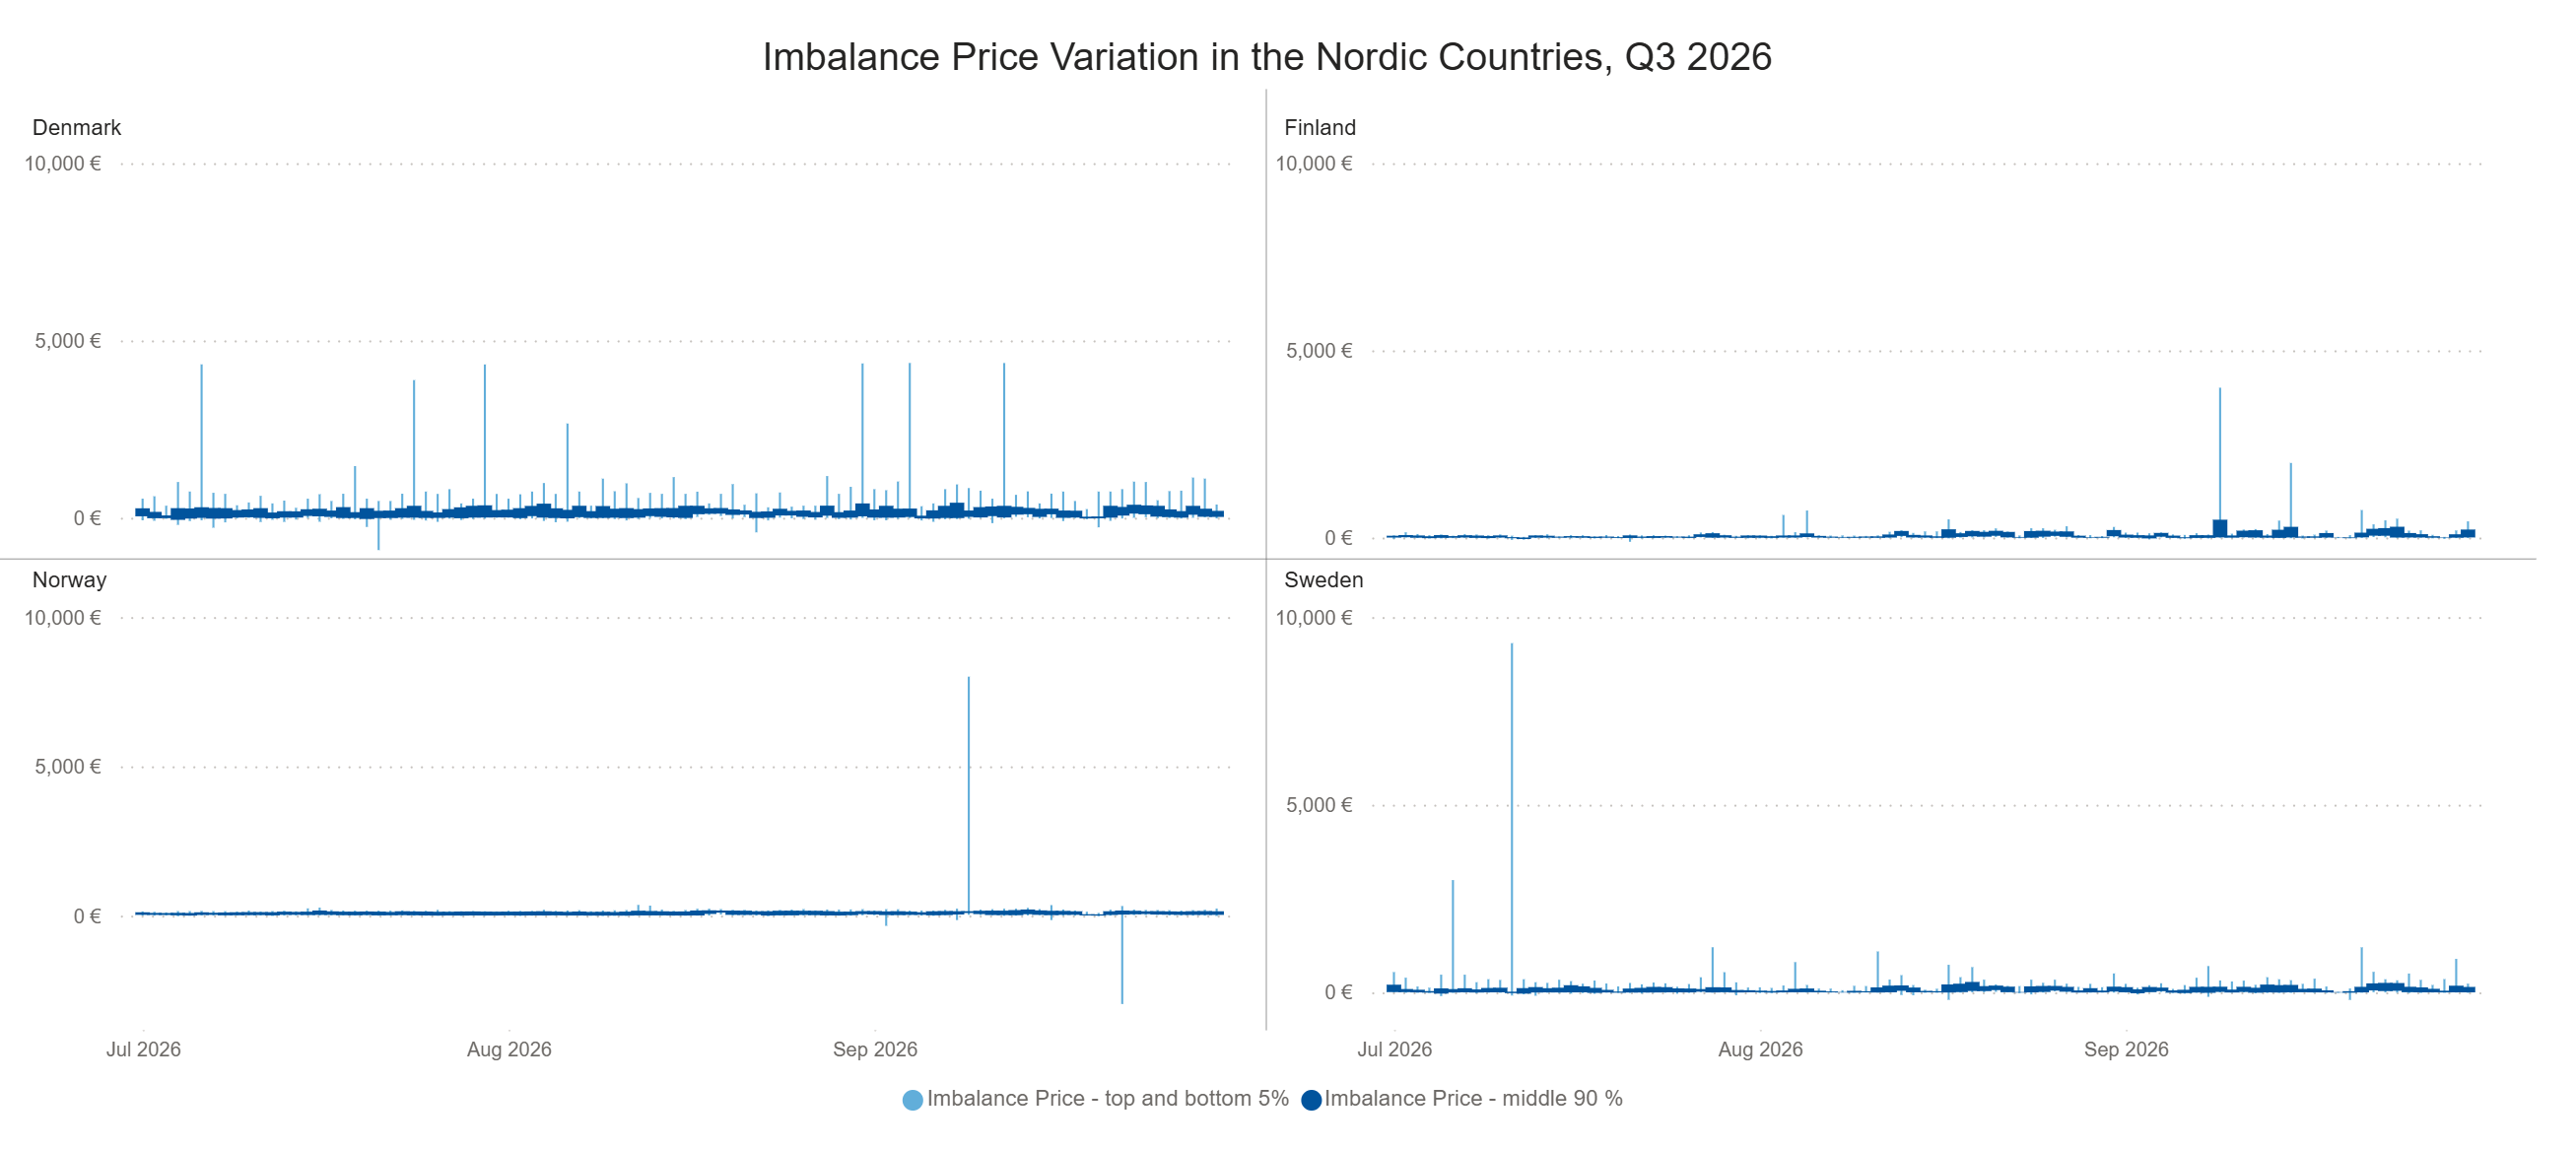
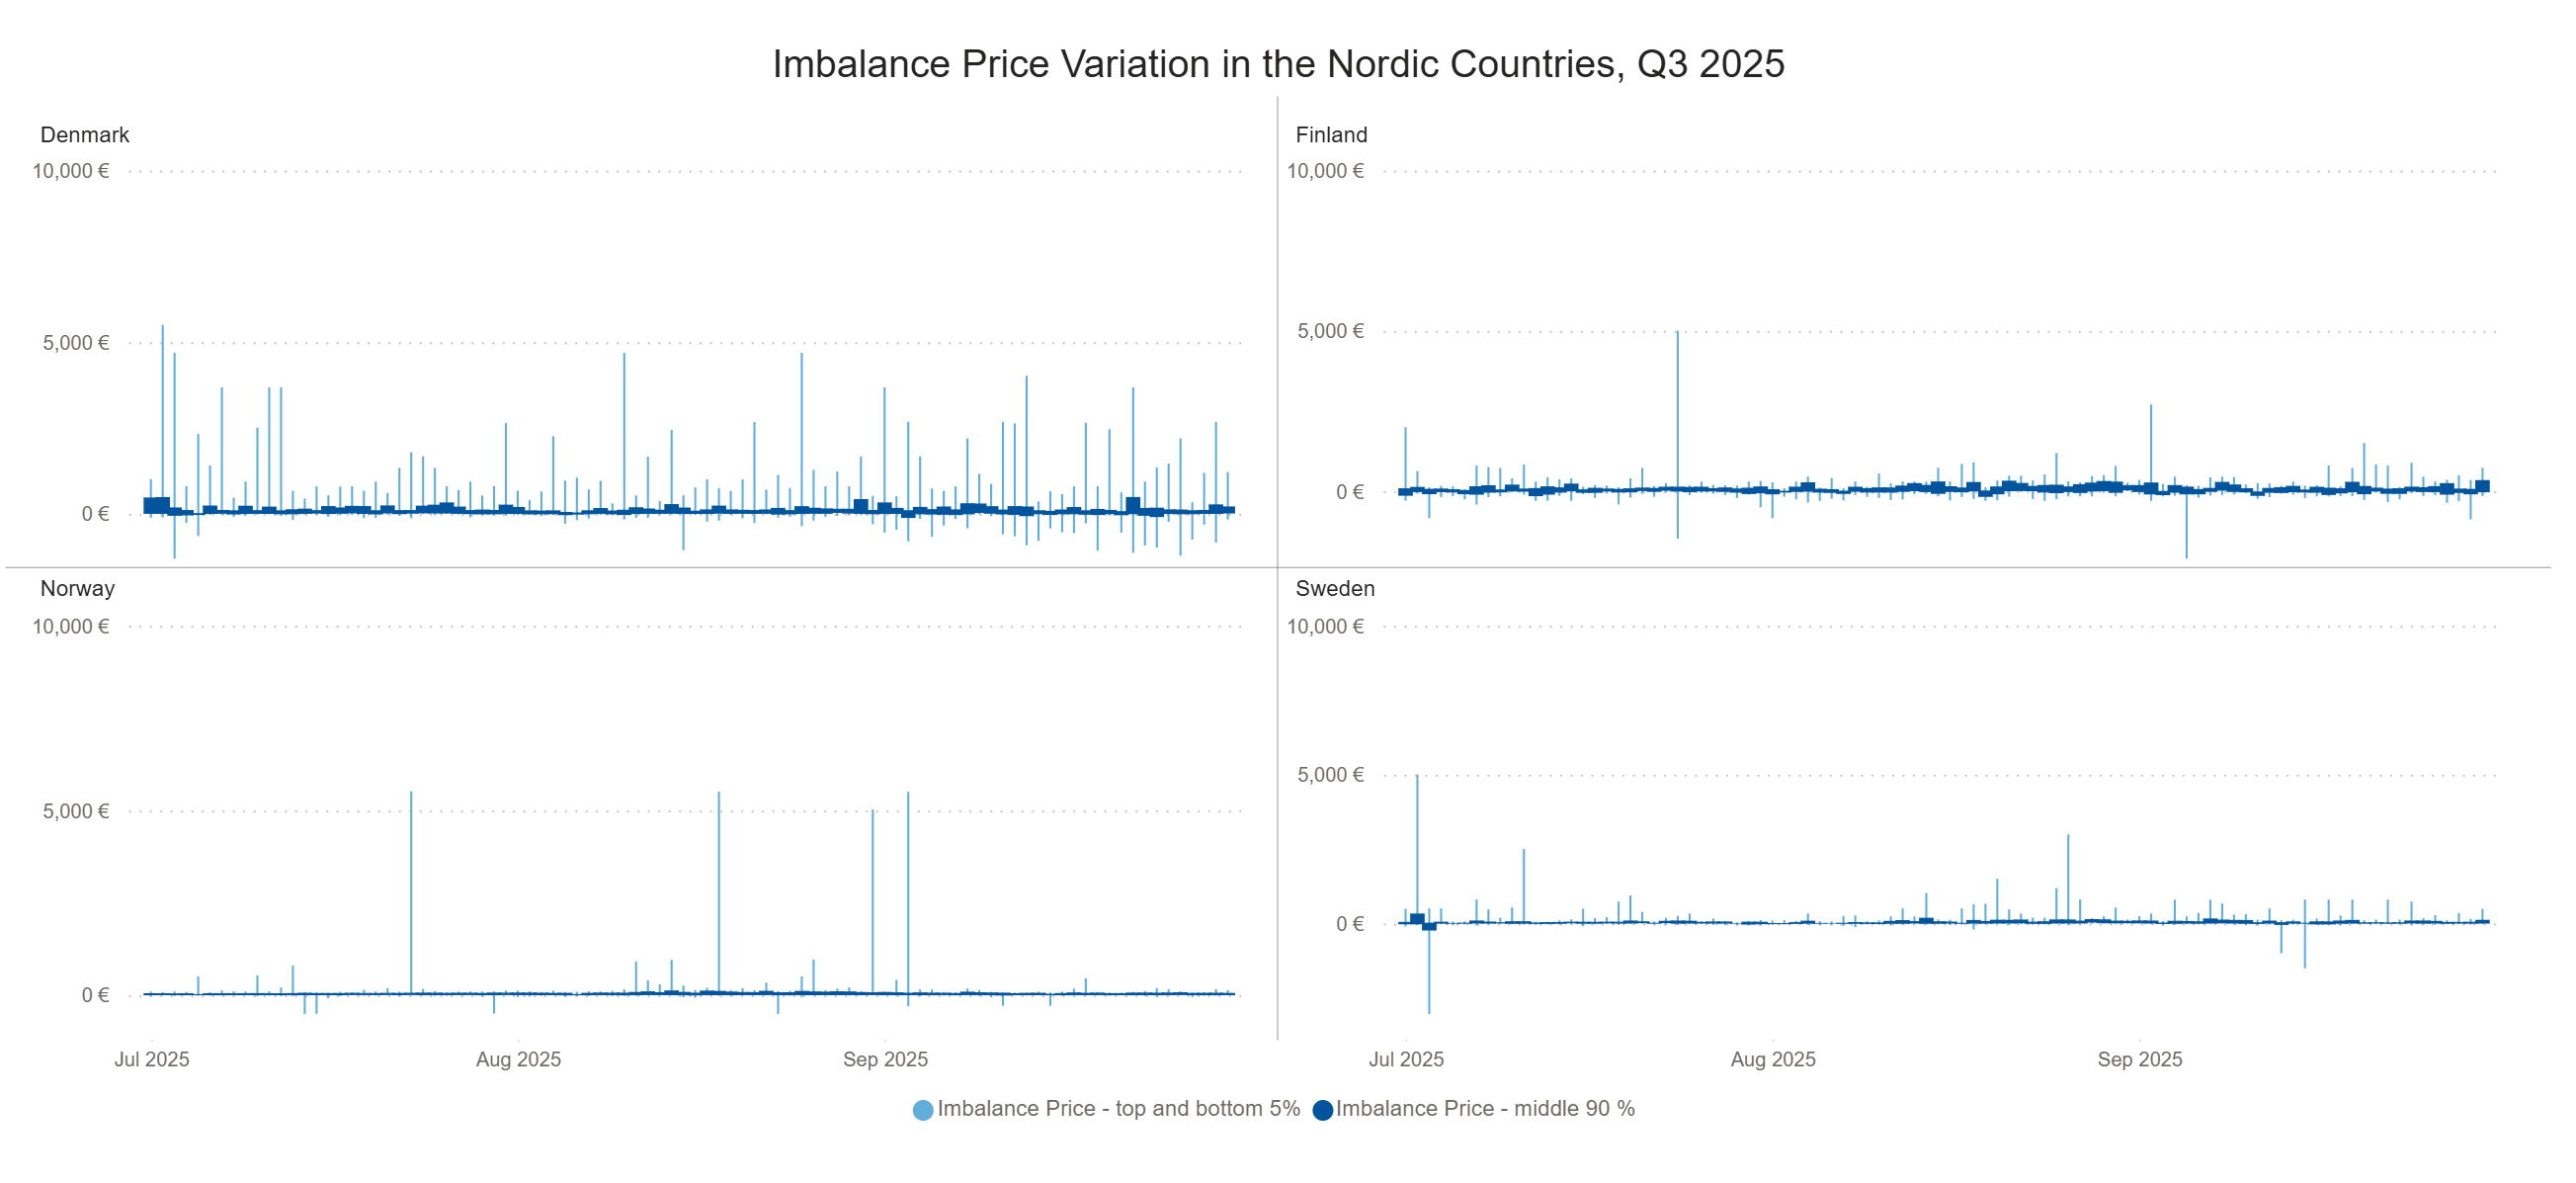 Imbalance prices were less volatile in Q3 2026 compared to the same period in 2025. While price spikes continued to occur across the Nordic countries, they were less frequent than a year earlier. The development was particularly noticeable in Norway, where the price spikes seen in Q3 2025 had almost completely disappeared during Q3 2026.
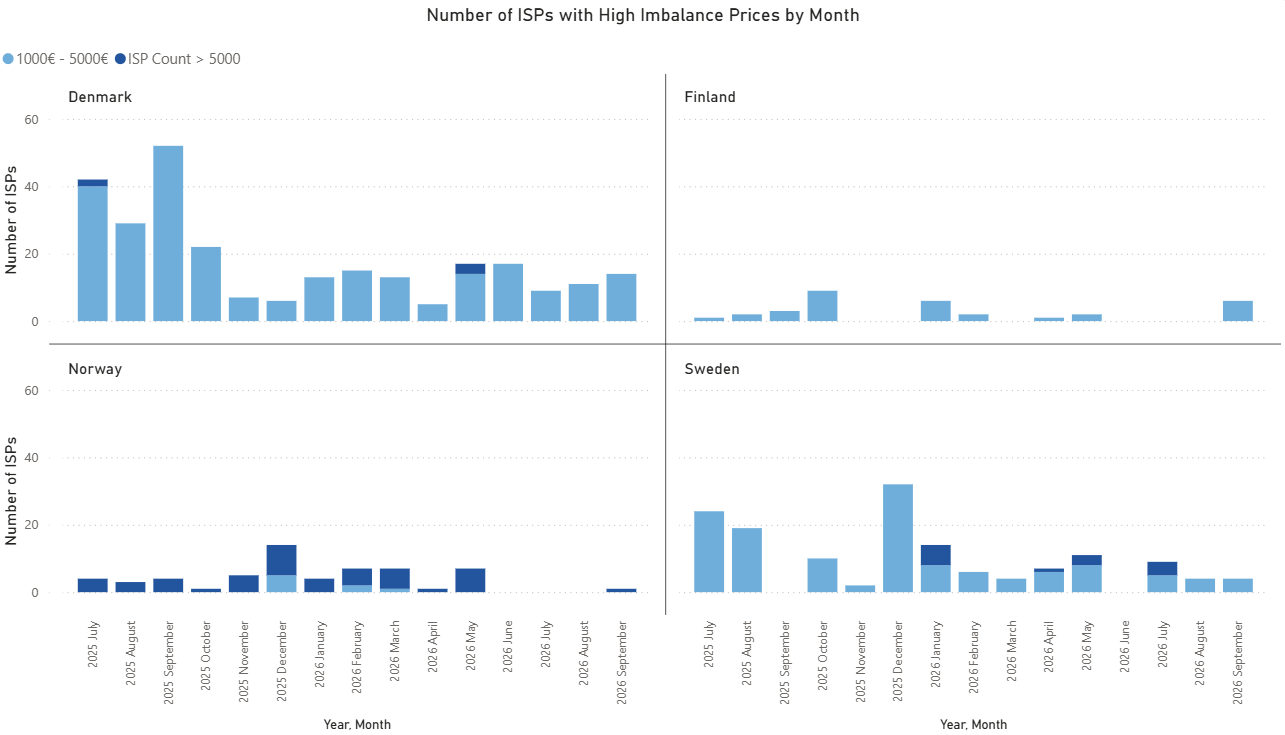
The graph shows the number of ISPs per MBA with imbalance prices above EUR 1,000 and EUR 5,000. The number of ISPs with high imbalance prices remained at a relatively low level during Q3 2026, with no indication of an increase compared to recent quarters. Overall, extreme imbalance price events have remained less frequent than during the more volatile periods observed in 2025.
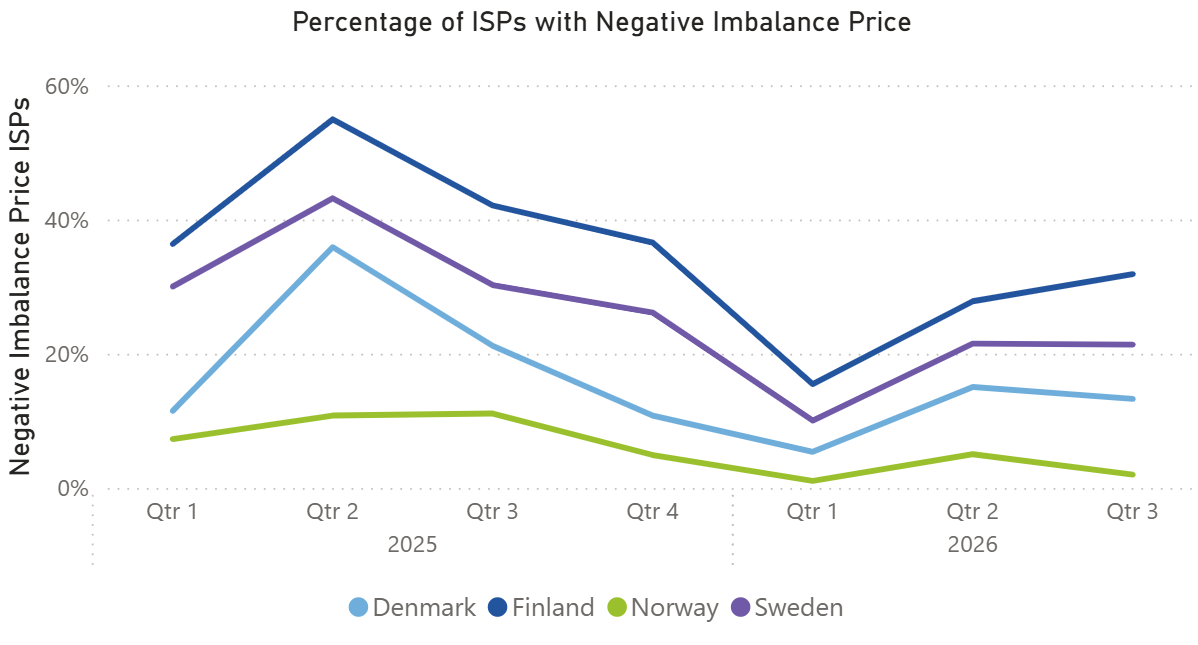
Negative imbalance prices were also less frequent in Q3 2026 than during the same period in 2025 across all Nordic countries. This continues the broader development seen during 2026, with the share of negative price ISPs remaining below the levels observed during much of 2025.
Absolute imbalance yearly moving average increased in Sweden and Denmark
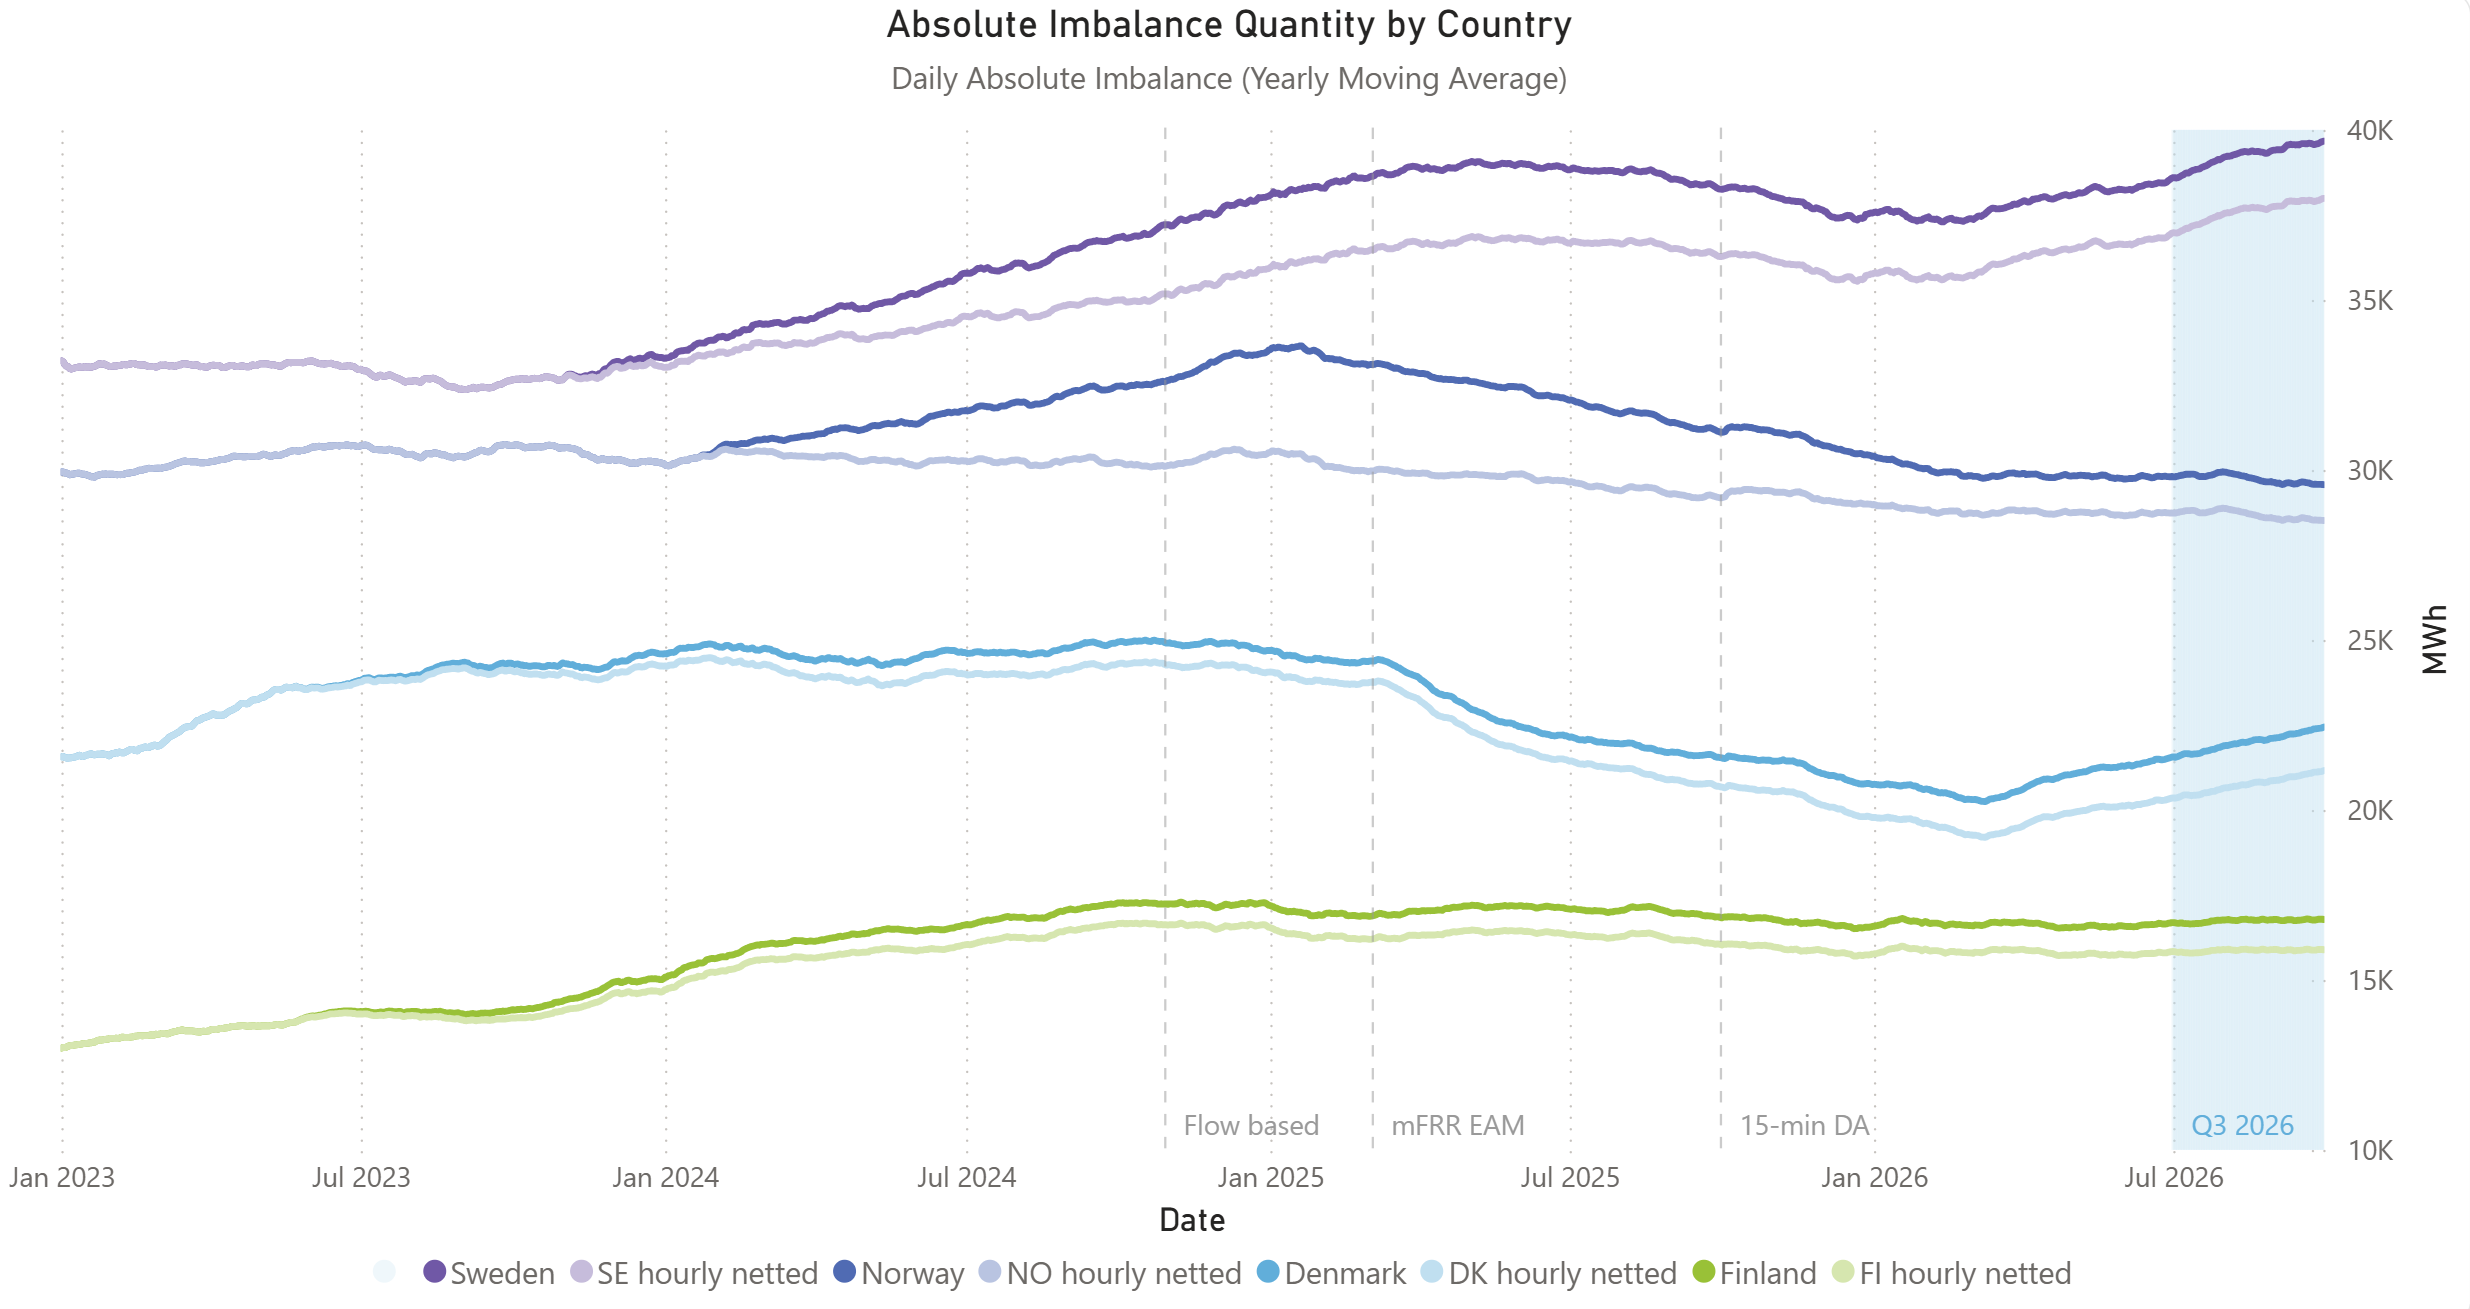
Absolute imbalance levels have developed differently across the Nordic countries. The yearly moving average increased in both Sweden and Denmark, with Sweden reaching its highest level so far. In Finland and Norway, absolute imbalance levels have remained relatively stable.
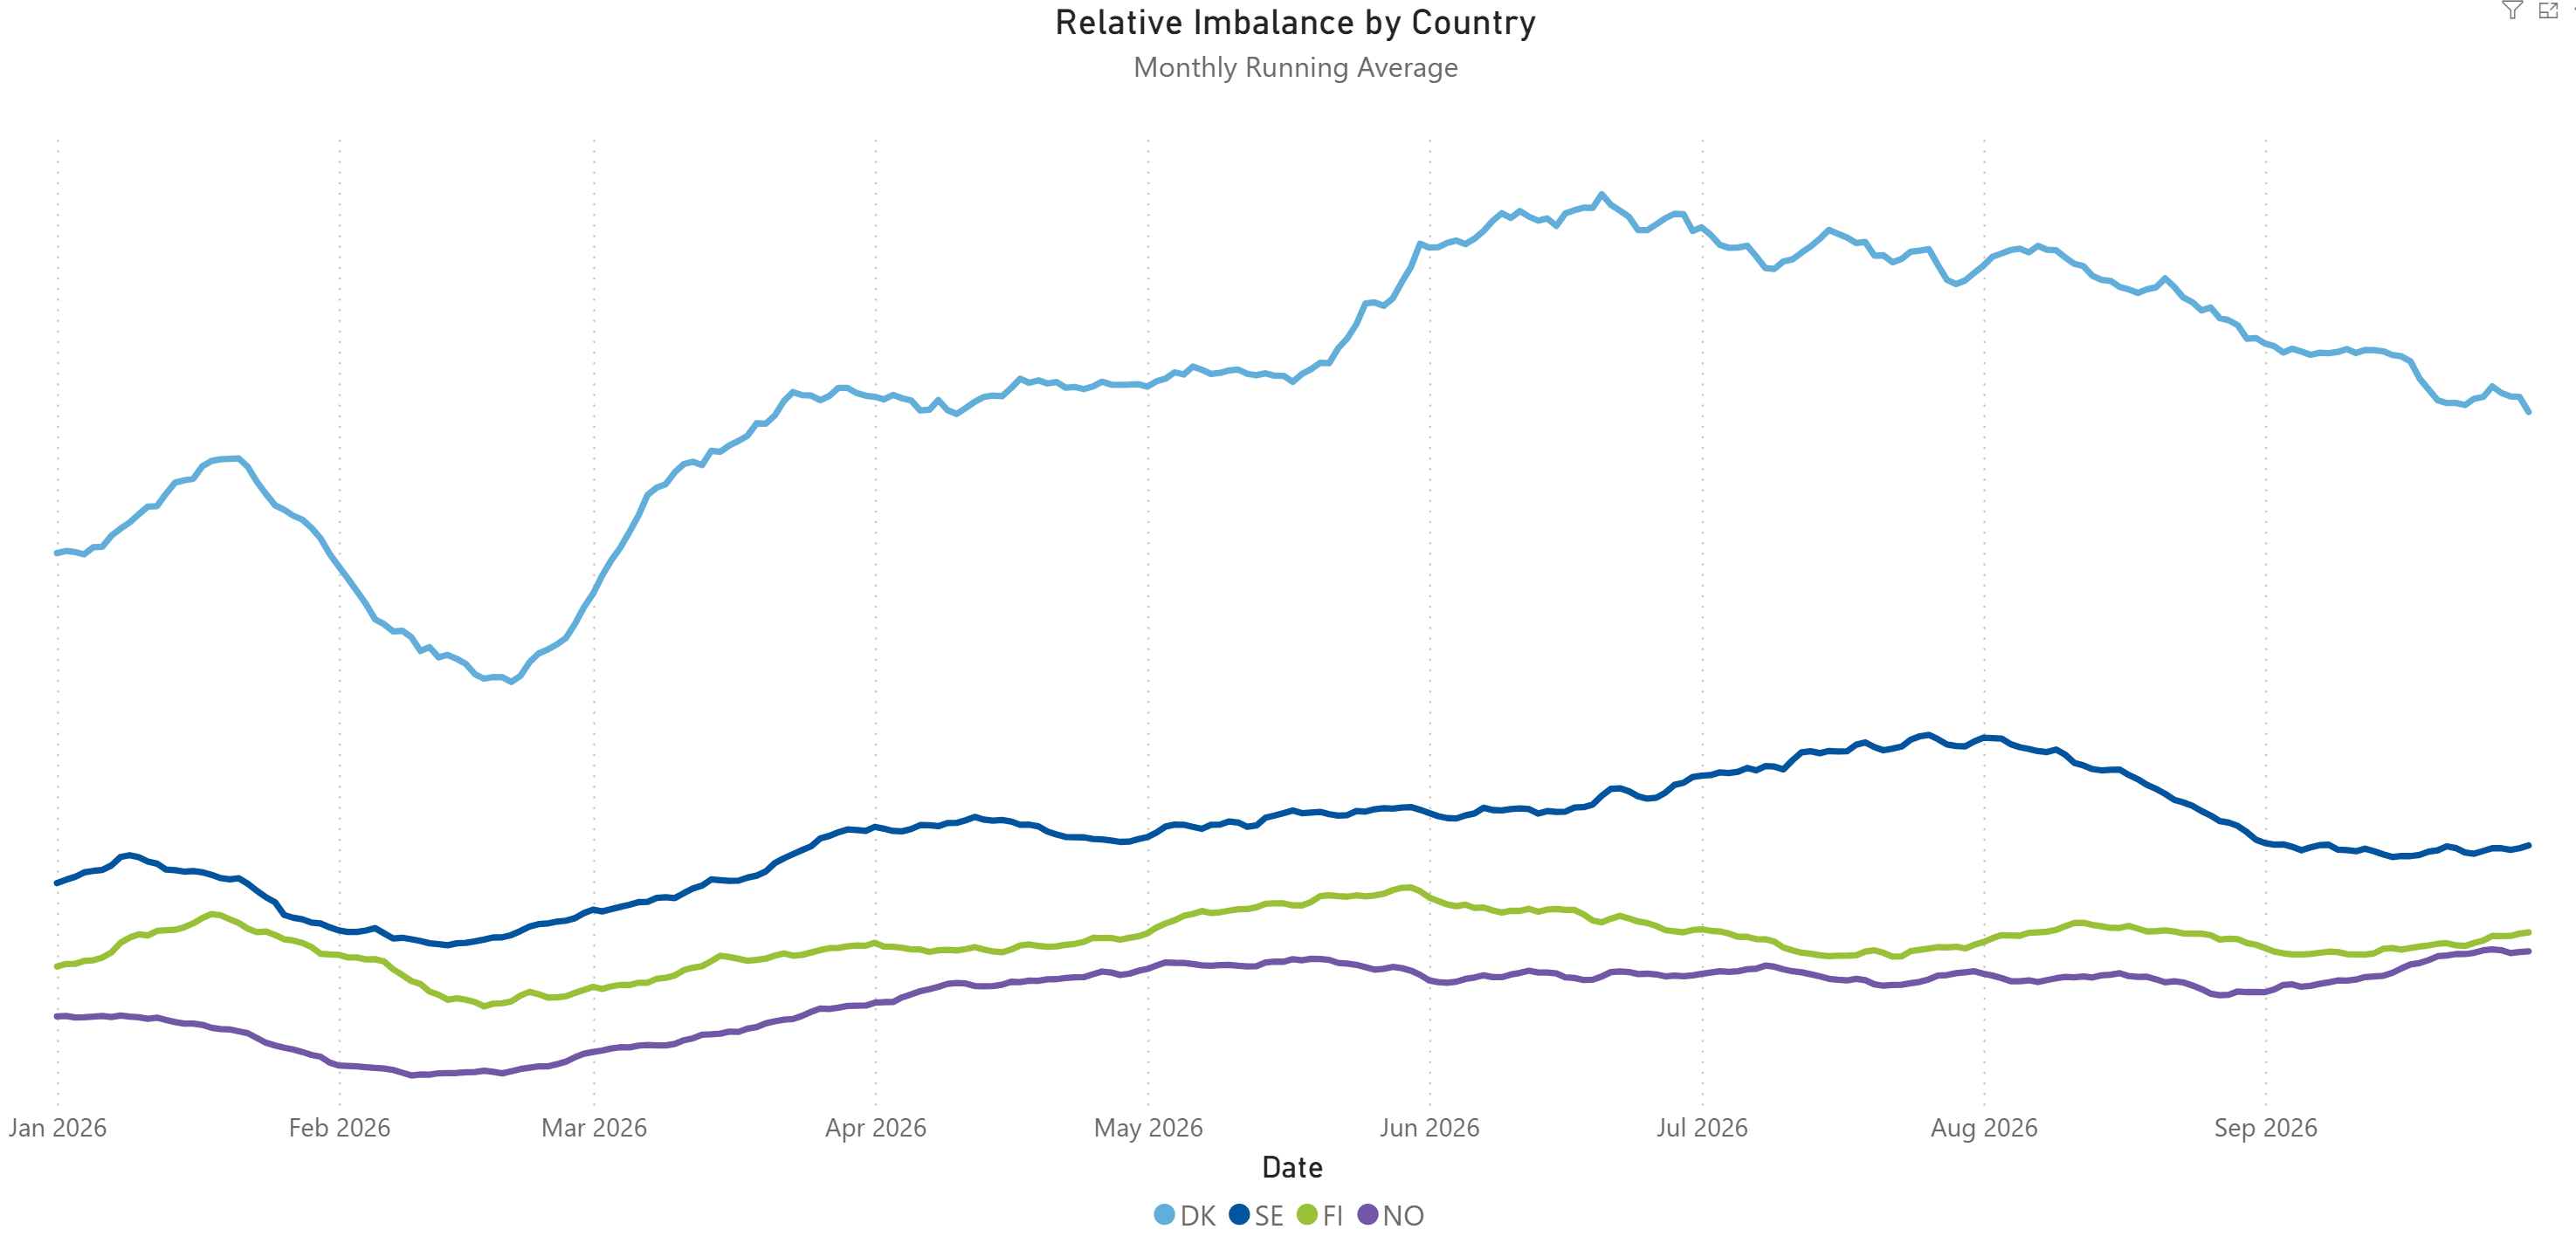
Relative imbalance measures imbalance volumes in relation to overall market activity. It is defined in the NBS Handbook and is calculated as:
Relative Imbalance = Absolute Imbalance Quantity / (|Consumption| + |Sales|)
The graph shows that relative imbalance levels vary between the Nordic countries, while following broadly similar seasonal patterns.
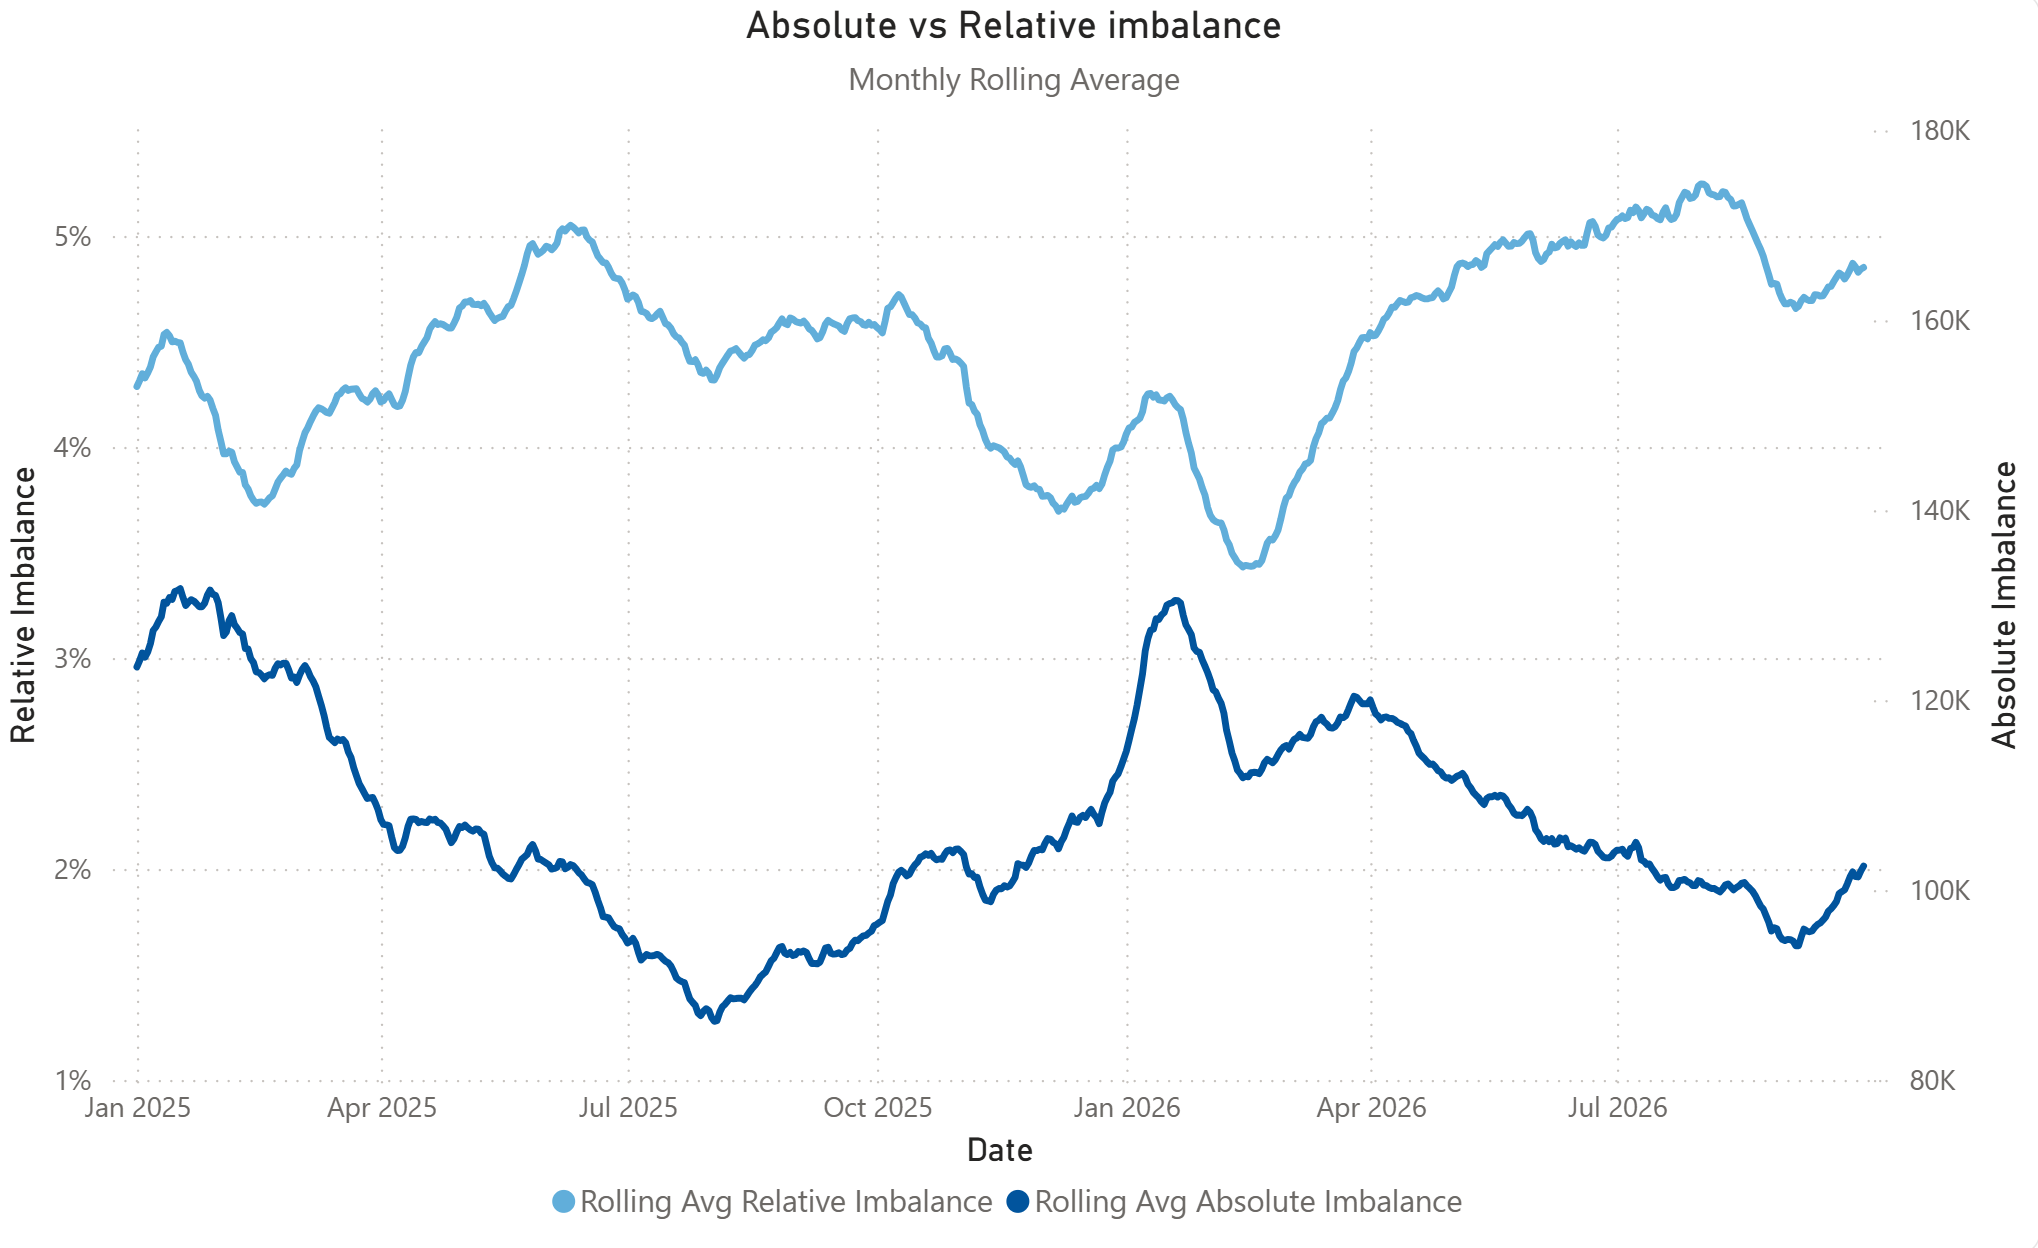
Absolute and relative imbalances show opposite seasonal trends. Relative imbalance tends to increase when absolute imbalance decreases, particularly during the summer months, while the opposite can be seen during winter. This is largely explained by seasonal changes in electricity demand. When demand is lower in summer, absolute imbalance volumes tend to decrease along with overall market volumes, while the remaining imbalance represents a larger share of total market activity, resulting in higher relative imbalance. During winter, higher demand has the opposite effect. Towards the end of Q3, however, both absolute and relative imbalance levels increased.
Trader BRPs continue to account for most new market entries
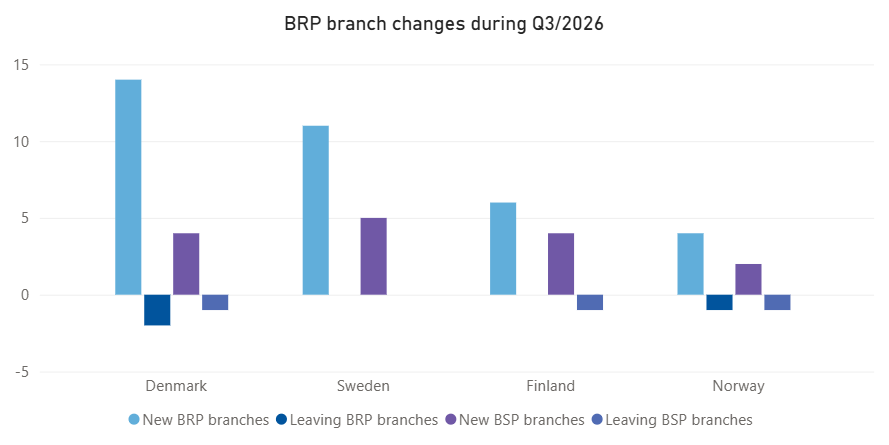
The number of market participants continued to grow in Q3 2026. The figure shows new and leaving BRP and BSP branches registered during the quarter by country. In total, 35 new BRP branches and 15 new BSP branches were registered, clearly exceeding the number of leaving branches. New BRP branches were recorded across all Nordic countries, with the strongest growth in Denmark and Sweden, while new BSP branches were also registered across all countries. As in previous quarters, traders accounted for most of the new BRPs entering the market and continued to drive the overall growth in the number of BRPs.
Reserve activation costs stabilise following recent market changes
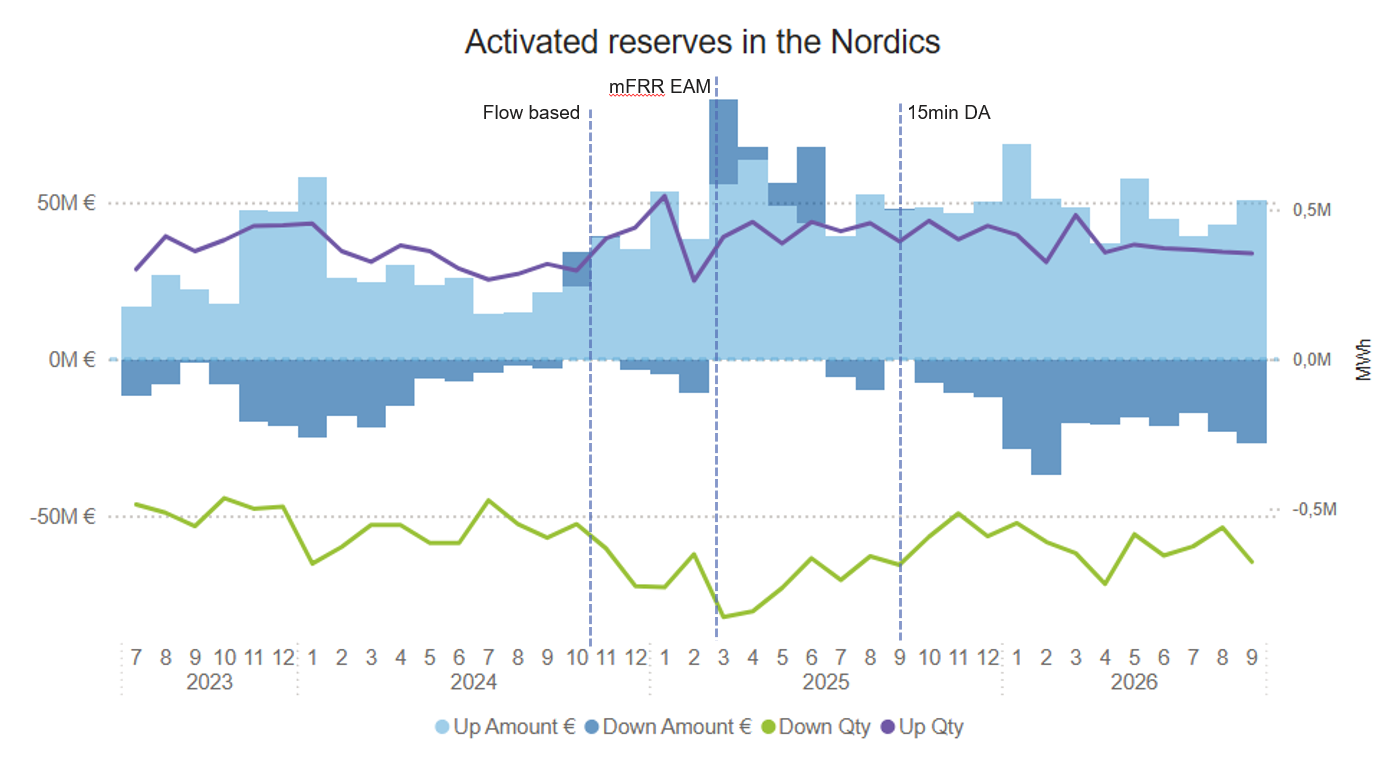
The Nordic reserve market has experienced significant changes over the past two years. Following the market changes, downward activated volumes initially increased, while the impact on activation amounts was more pronounced in both directions. The positive downward activation amounts seen after the mFRR EAM go-live in 2025 may partly be linked to the peak in negative imbalance prices during the same period.
During 2026 the development has become more stable. At Nordic level, both activated volumes and associated costs have remained relatively steady compared to the larger fluctuations seen around the major market changes.
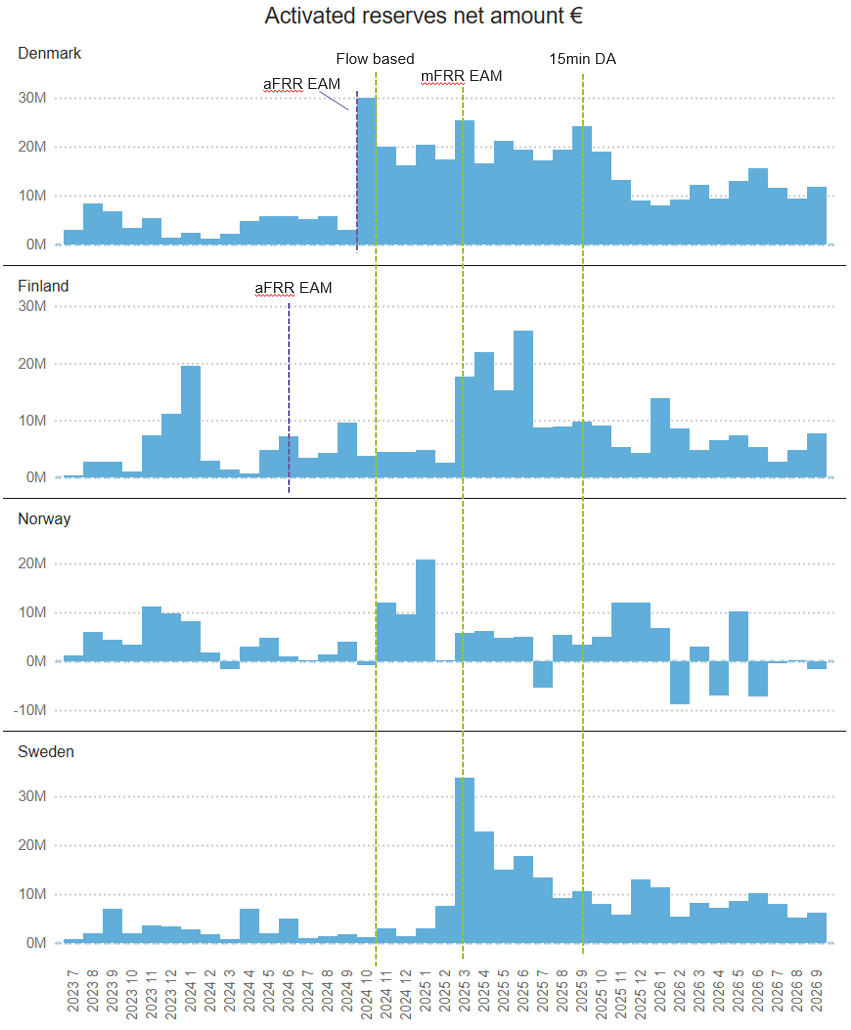
At country level, the development shows considerably more variation. Looking at the net activation amount, calculated as the combined up- and downward activation amounts, increases occurred at different times and with different magnitudes across the Nordic countries. The introduction of mFRR EAM coincided with the most significant overall change in reserve costs, particularly visible in Sweden and Finland. The earlier national aFRR EAM go-lives also coincided with changes in Denmark and Finland, with a more pronounced impact visible in Denmark.
More recently, net activation amounts have generally stabilised across the individual countries, although differences between countries and month-to-month variation remain.
Key messages
Imbalance prices were less volatile in Q3 2026, with fewer extreme and negative price events than during the same period in 2025. Absolute imbalance levels developed differently across the Nordic countries, increasing in Sweden and Denmark while remaining relatively stable in Finland and Norway. Market participant growth continued, and reserve activation costs remained more stable following the larger fluctuations around recent market changes.